小白学习DeepSeek之本地化部署,还能写小红书文案、创建知识库

只需三步,即可完成一个本地化DeepSeek体验环境。

在学习完 给小白3天学会DeepSeek的锦囊 后,有一定工程基础的同学可以在本地部署一个DeepSeek测试环境,更近距离体验DeepSeek。

部署DeepSeek环境无需专业的GPU显卡,本文的测试环境就是基于普通PC机完成,其配置为 两核Intel i7 CPU、64G内存、SSD盘,已安装Linux系统(在Windows环境下也能体验)。
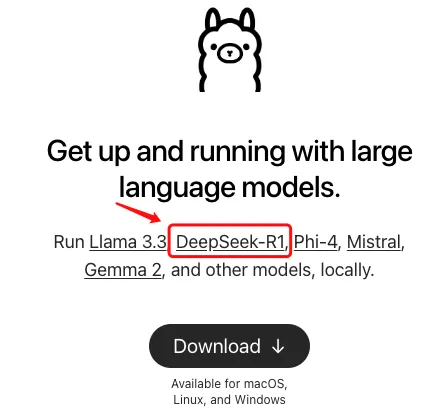
第1步,下载安装ollama

Ollama 是一个开源的 AI 平台,由 Meta 开发,允许用户运行、自定义并训练各种语言模型。它支持多种预训练模型(如 GPT-4, Claude, DeepSeek 等),并提供友好的用户界面和工具链,适用于开
发者和研究者。官网地址:https://ollama.com

如果服务器在墙外,则可以直接执行下面的命令一键完成安装

$ wget -c https://ollama.com/install.sh | sh

如果是在墙内,则需要先手动下载二进制安装包

$ wget -c https://ollama.com/download/ollama-linux-amd64.tgz

如果上述链接还是无法下载,可以下载我分享到百度云盘上的资源 https://pan.baidu.com/s/1a4DVIqag8FJdUtLwfxmotg?pwd=deep

上传到Linux服务器上,然后手动完成安装部署。

先创建相关用户

$ useradd -r -s /bin/false -U -m -d /usr/share/ollama ollama
$ usermod -a -G render ollama
$ usermod -a -G video ollama
$ usermod -a -G ollama $(whoami)

编辑ollama服务配置文件 /etc/systemd/system/ollama.service,参考下面的内容

[Unit]
Description=Ollama Service
After=network-online.target

[Service]
ExecStart=/usr/local/bin/ollama serve
User=ollama
Group=ollama
Restart=always
RestartSec=3
Environment="PATH=/root/.pyenv/shims:/root/.pyenv/bin:/root/perl5/bin:/usr/local/sbin:/usr/local/bin:/usr/sbin:/usr/bin:/root/bin:/usr/local/mysql-latest/bin"
Environment="OLLAMA_HOST=0.0.0.0"
Environment="OLLAMA_ORIGINS=*"

[Install]
WantedBy=default.target

重新加载并重启ollama服务

$ systemctl daemon-reload && systemctl restart ollama

查看ollama服务运行状态

$ systemctl status ollama

● ollama.service - Ollama Service
   Loaded: loaded (/etc/systemd/system/ollama.service; enabled; vendor preset: disabled)
   Active: active (running) since Thu 2025-02-06 15:32:58 CST; 11min ago
 Main PID: 13451 (ollama)
    Tasks: 15
   Memory: 2.3G
   CGroup: /system.slice/ollama.service
           ├─13451 /usr/local/bin/ollama serve
           └─19845 /usr/local/lib/ollama/runners/cpu_avx2/ollama_llama_server runner --model /usr/share/ollama/.ollama/models/blobs/sha256-aabd4debf0c8f0
...

查看端口监听状态

ss -anlp|grep 11434

tcp    LISTEN     0      128    [::]:11434              [::]:*                   users:(("ollama",pid=13451,fd=3))

在浏览器中访问地址 http://192.168.0.123:11434 (192.168.0.123是我的测试机IP地址),浏览器中如果出现下面的提示即为成功

Ollama is running

第1步完成。

第2步,部署DeepSeek R1模型

在ollama官网首页上,就有DeepSeek-R1模型的入口,点击进入。

默认的版本是7b,不同版本对应的体积大小不同,体积越大模型越精细化,运行它们所需要的内存也分别不同。各版本所需内存大约如下表所示,可根据自己测试机配置选择合适的版本

版本 所需内存预估
1.5b 1.5G
7b 5G
8b 6G
14b 20G

在这里我选择了8b版本。

$ ollama run deepseek-r1:8b

然后就耐心等待吧,如果中间失败了也没关系,ollama支持断点续传,再次执行即可。最终运行成功后大概像下面这样

...
pulling manifest
pulling aabd4debf0c8... 100% ▕████████████████████████████████████████████████████████████████████████████████████████████▏ 1.1 GB
pulling 369ca498f347... 100% ▕████████████████████████████████████████████████████████████████████████████████████████████▏  387 B
...
verifying sha256 digest
writing manifest
success
>>> 请你简单介绍下DeepSeek,谢谢
<think>
嗯,用户让我介绍一下DeepSeek。首先,我得确定DeepSeek是什么,是AI公司还是公司的名称?可能是一个科技公司或者一个专注特定领域的企业。
...
</think>

DeepSeek是一家专注于人工智能技术的研究公司或企业。它致力于开发智能化解决方案,涵盖多个领域如语音识别、图像处理、数据分析等。DeepSeek的核心目标是为复杂问
题提供高效智能支持,帮助用户提升效率并应对挑战。
...
>>> /bye

第2步,也部署成功了,并且已经能回答一些基本问题,可以根据前文 给小白3天学会DeepSeek的锦囊 提供的方法试着玩一玩。

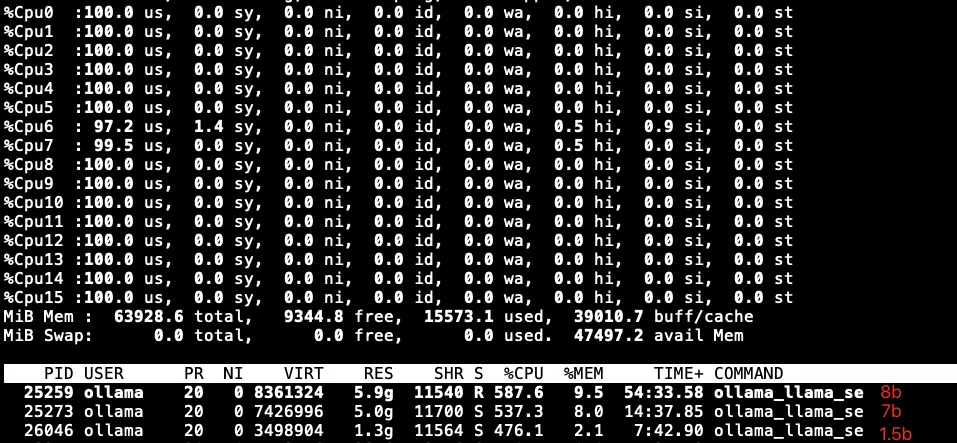
向DeepSeek提问时,能看到此时CPU在满负荷工作中

执行 ollama list 列出当前已下载的模型列表

$ ollama list
NAME                ID              SIZE      MODIFIED
deepseek-r1:1.5b    a42b25d8c10a    1.1 GB    30 hours ago
deepseek-r1:8b      28f8fd6cdc67    4.9 GB    30 hours ago
deepseek-r1:7b      0a8c26691023    4.7 GB    30 hours ago

第3步,部署可视化交互界面

接下来可以从Chatbox、open-webui、Dify中选择一个可视化交互界面方案。

  • Chatbox是一个对话工具,可以导入各种大模型平台的API,或者本地部署模型的API也都是可以的,官网地址:https://www.chatboxai.app/zh

  • Open WebUI 是一个功能强大的开源 AI 界面,支持多种 AI 模型的接入,包括 Ollama、OpenAI API 等。本教程将指导你如何在 Open WebUI 中配置和使用 Deepseek API,让你能够快速搭建自己的 AI 助手系统。官网地址:https://docs.openwebui.com

  • Dify 是一款开源的大语言模型(LLM) 应用开发平台。它融合了后端即服务(Backend as Service)和 LLMOps 的理念,使开发者可以快速搭建生产级的生成式 AI 应用。即使你是非技术人员,也能参与到 AI 应用的定义和数据运营过程中。官网地址: https://docs.dify.ai/zh-hans

我选择了Open WebUI,因为可以用Docker来完成部署,更方便快捷。

在开始之前,先修改Docker配置文件 /etc/docker/daemon.json,增加国内的镜像源地址(不得不吐槽下,很多资源被墙了,经常要各种折腾,费时费力)

{
  "registry-mirrors" : [ "https://docker.nju.edu.cn", "https://ghcr.nju.edu.cn", "https://gcr.nju.edu.cn", "https://ngc.nju.edu.cn", "https://quay.nju.edu.cn"],
  "insecure-registries": [ "https://docker.nju.edu.cn", "https://ghcr.nju.edu.cn", "https://gcr.nju.edu.cn", "https://ngc.nju.edu.cn", "https://quay.nju.edu.cn"],
  "experimental": true
}

重启Docker使之生效

$ systemctl daemon-reload && systemctl restart docker

如果是podman环境,则修改配置文件 /etc/containers/registries.conf,同样地,增加国内镜像资源:

unqualified-search-registries = ["docker.nju.edu.cn", "ghcr.nju.edu.cn", "gcr.nju.edu.cn", "ngc.nju.edu.cn", "quay.nju.edu.cn"]

运行下面的命令,利用Docker一键完成

$ docker run -itd -p 3000:8080 -e OLLAMA_BASE_URL=http://192.168.0.123:11434 -v open-webui:/app/backend/data --name ollama-open-webui --restart always ghcr.nju.edu.cn/open-webui/open-webui:main
...

$ docker ps | grep -i webui
e5ec34b719eb  ghcr.nju.edu.cn/open-webui/open-webui:main  bash start.sh  4 seconds ago  Up 4 seconds ago  0.0.0.0:3000->8080/tcp  ollama-open-webui

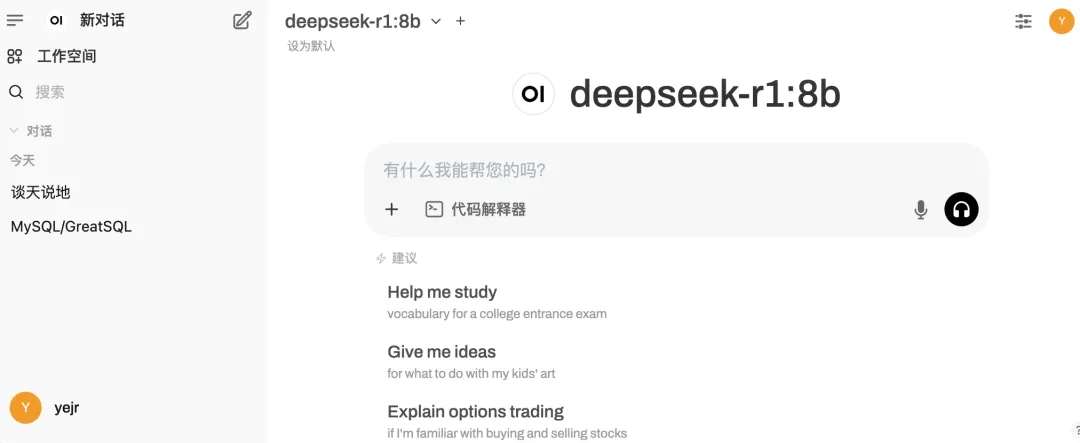
容器创建成功后,需要先进行初始化工作,等待一会儿再在浏览器中输入地址 http://192.168.0.123:3000 访问,如果可以看到下面的内容就表示成功

第一次打开时需要先创建管理员账户,然后登入,就可以看到下面这样的界面,这就可以在浏览器和DeepSeek进行对话

接下来,点击左上角 “工作空间” => “知识库”,创建我们自己的知识库。可以选择上传单个文件,也可以将整个本地知识库目录都上传,也可以在线添加文本资料。

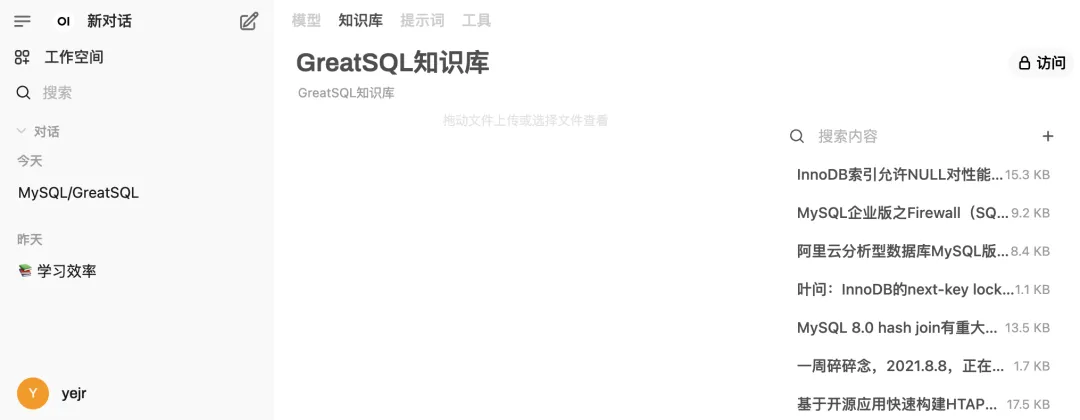
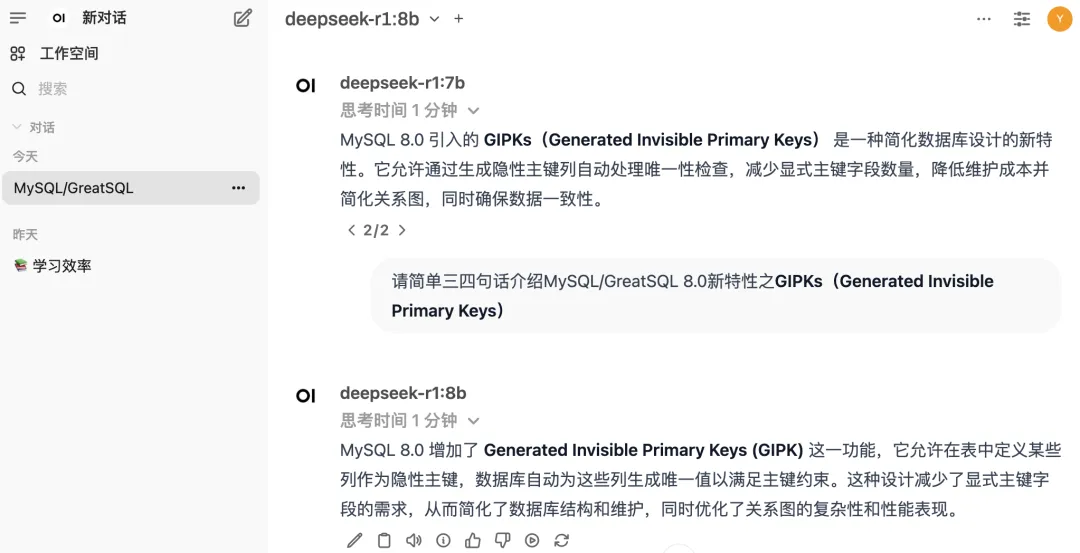
我体验了几次问答,如果是一些简单的常识问题,本地的DeepSeek-R1 8b版本基本上还能应付得来,如果问的是一些关于MySQL/GreatSQL专业的问题,它就开始有点胡说八道了。可见如果想要得到更好的效果和更专业的回答内容,还需要用更好的服务器配置并选择更高版本的DeepSeek模型。

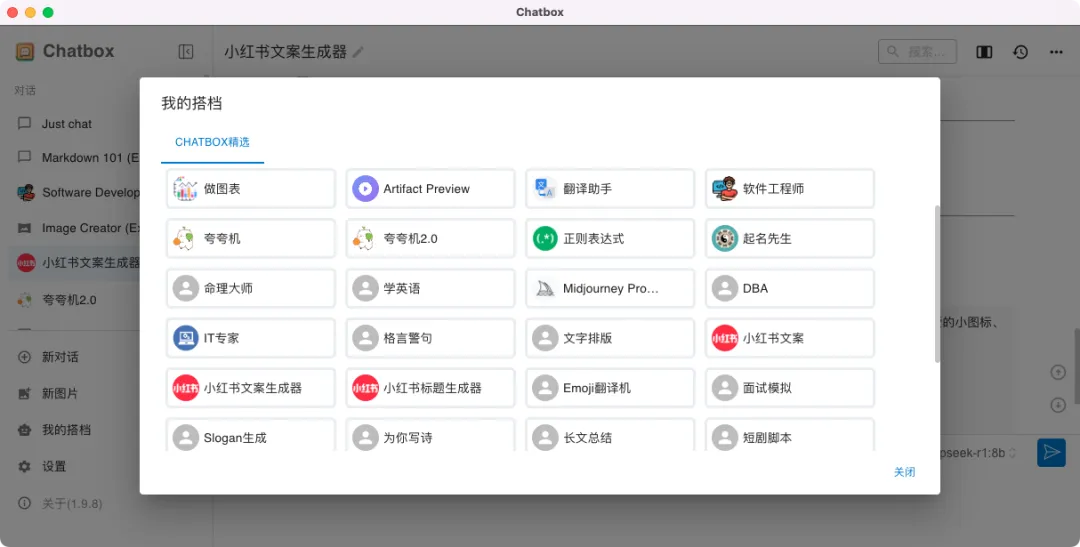
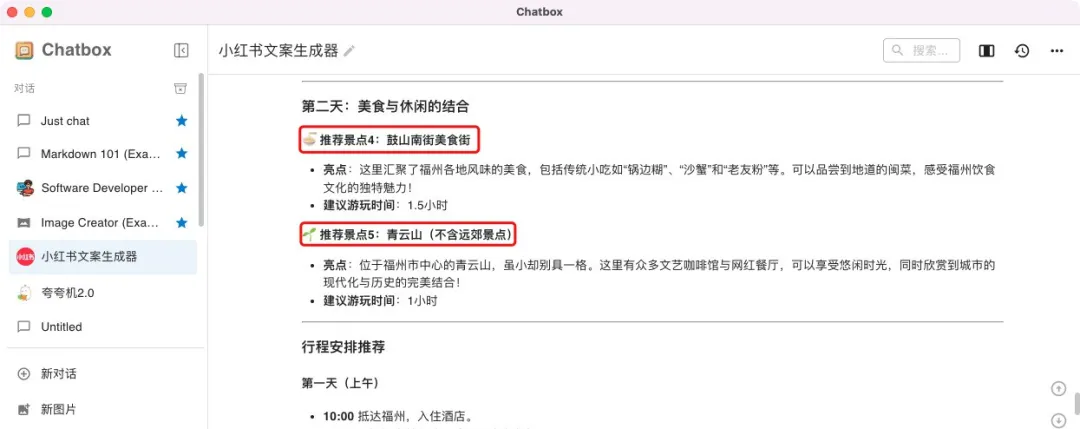
写到这里,我也尝试了用Chatbox来接入本地的DeepSeek,它还搭载了很多好玩的AI组件,非常方便实用

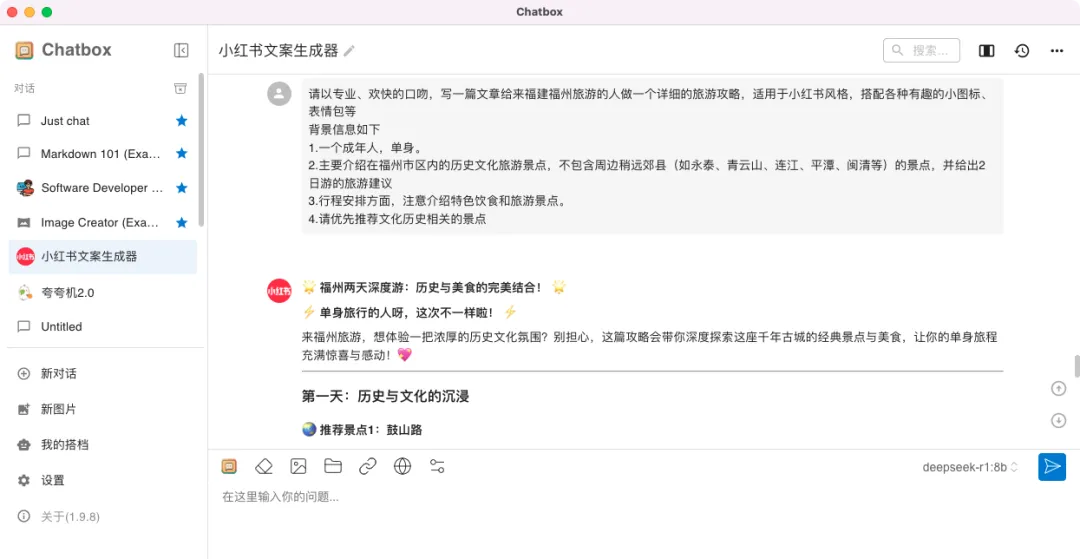
让它帮忙写一个福建福州市区轻松文旅游攻略的文案试试看,在它的回答中仍有挺多待改进的地方,例如我要求不包含永泰等郊县,但还是推荐了青云山景点

这次先写到这里。在最后,分享一个南京大学的Docker镜像资源,可以方便的在墙内拉取到很多Docker镜像,详见:https://sci.nju.edu.cn/9e/05/c30384a564741/page.htm

给小白3天学会DeepSeek的锦囊

从蛇年春节前开始,DeepSeek无疑是最热门的话题,没有之一,无论是技术圈还是非技术圈,几乎都在讨论它。今天我们就让DeepSeek来帮助小白用户们,只需要花3天时间就能学会如何更好地使用DeepSeek。

下面是我在DeepSeek回答结果的基础上,二次加工整理及补充部分内容而成。


第1天:了解DeepSeek的基本功能

1. 什么是DeepSeek?

DeepSeek是一款智能工具,可以帮助你完成各种任务,比如写文章、回答问题、提供建议等。它就像你的私人助手,随时为你服务。

2. 如何启动DeepSeek?

  • 浏览器中打开DeepSeek的网站(https://www.deepseek.com)或在应用市场搜索安装“DeepSeek”。
  • 登录你的账号(如果没有账号,先注册一个。提示:支持用微信登入)。
  • 进入主界面,你会看到一个输入框,这就是你与DeepSeek互动的地方。 enter image description here

3. 尝试第一次对话

  • 在输入框里输入一个问题或需求,比如:“我是六年级学生,请问如何利用DeepSeek帮助我提高学习效率,谢谢”。
  • 可以在下方选中“深度思考(R1)”,还可以向你展示DeepSeek深度思考的过程。
  • 点击“发送”或按回车键,DeepSeek会立即回复你。

今日目标:

  • 熟悉DeepSeek的界面。

  • 尝试提出一个问题,看看DeepSeek如何回答。


第2天:掌握DeepSeek的进阶用法

1. 如何让DeepSeek更好地理解你?

  • 清晰表达: 尽量用简单的语言描述你的需求。比如,“我是小学六年级学生,请帮我写一篇300字的文章,主题是‘如何保护环境’,谢谢”。
  • 提供细节: 如果需要特定风格或格式,可以告诉DeepSeek。比如,“请用轻松幽默的语气写一篇适合发布在小红书上关于吸猫的文章,谢谢”。

2. 使用DeepSeek的多种功能

  • 写作助手: 让DeepSeek帮你写文章、邮件、报告等。
  • 学习工具: 向DeepSeek提问,比如“用小学生能理解的语言解释什么是人工智能”它会用简单易懂的语言解释。
  • 生活建议: 比如“请帮我规划一个最近非常热门的旅游城市泉州的短期的、轻度的、适合带娃的旅行计划,预计周五晚上出发,到周日下午结束,谢谢”。

3. 保存和分享结果

  • 如果DeepSeek的回答对你有用,可以复制内容保存到文档中。
  • 你也可以直接分享给朋友或同事。

今日目标:

  • 尝试用不同的方式提问(相比上一次提问调整一些提示词、关键词或者预设角色条件),看看DeepSeek的回答有什么变化。

  • 使用DeepSeek完成一项实际任务,比如写一封邮件或规划一个日程。


第3天:深入使用DeepSeek

1. 探索DeepSeek的隐藏功能

  • 多轮对话: DeepSeek可以记住上下文。比如,你可以先问“什么是人工智能”,接着问“它有哪些应用”DeepSeek会根据之前的对话继续回答。
  • 语言切换: 如果需要用其他语言交流,可以直接告诉DeepSeek,比如“用英语/中文回答我。”。

2. 提高效率的小技巧

  • 使用模板: 如果你经常需要完成类似的任务,可以保存一些常用指令模板,比如“帮我写一篇关于XX的文章,字数300字,语气正式”。
  • 批量处理: 如果需要处理多个任务,可以一次性输入多个问题,DeepSeek会依次回答。
  • 回复内容格式设定:如果需要让DeepSeek回复的答案直接符合你的文章格式要求,可以直接告诉DeepSeek,比如下面这样:

请参考下面的PPT内容结构,帮我整理几页标题为《节约用水,保护地球》的PPT内容。内容素材参考链接:https://www.abcdefg.net 及其二级、三级下属资源链接 PPT内容结构模板如下:
# 一级目录/内容
## 二级目录/内容
### 三级目录/内容

3. 反馈与优化

  • 如果DeepSeek的回答不符合你的预期,可以尝试重新提问或提供更多细节。
  • 你也可以通过反馈功能告诉开发团队你的建议,帮助DeepSeek变得更好。

今日目标:

  • 尝试多轮对话,感受DeepSeek的上下文理解能力。

  • 使用模板或批量处理功能,提高工作效率。


总结:3天学会DeepSeek的关键点

  1. Day 1:熟悉界面,尝试第一次对话。
  2. Day 2:掌握进阶用法,完成实际任务。
  3. Day 3:探索隐藏功能,成为使用高手。

按照这个攻略,3天后你就能轻松驾驭DeepSeek,让它成为你的得力助手!如果有任何问题,随时可以回来查看这份攻略。祝你使用愉快!

最后,你在使用DeepSeek时遇到了哪些有趣的事情?欢迎在评论区分享你的体验!如果你觉得这份攻略有用,请点赞、转发,让更多人看到!

MySQL运行时的可观测性

感知SQL运行时的状态

1. 说在前面的话

在MySQL里,一条SQL运行时产生多少磁盘I/O,占用多少内存,是否有创建临时表,这些指标如果都能观测到,有助于更快发现SQL瓶颈,扑灭潜在隐患。

从MySQL 5.7版本开始,performance_schema就默认启用了,并且还增加了sys schema,到了8.0版本又进一步得到增强提升,在SQL运行时就能观察到很多有用的信息,实现一定程度的可观测性。

下面举例说明如何进行观测,以及主要观测哪些指标。

2. 安装employees测试库

安装MySQL官方提供的employees测试数据库,戳此链接(https://dev.mysql.com/doc/index-other.html)下载,解压缩后开始安装:

$ mysql -f < employees.sql;

INFO
CREATING DATABASE STRUCTURE
INFO
storage engine: InnoDB
INFO
LOADING departments
INFO
LOADING employees
INFO
LOADING dept_emp
INFO
LOADING dept_manager
INFO
LOADING titles
INFO
LOADING salaries
data_load_time_diff
00:00:37

MySQL还提供了相应的使用文档:https://dev.mysql.com/doc/employee/en/

本次测试采用GreatSQL 8.0.32-24版本,且运行在MGR环境中:

greatsql> \s
...
Server version:         8.0.32-24 GreatSQL, Release 24, Revision 3714067bc8c
...

greatsql> select MEMBER_ID, MEMBER_ROLE, MEMBER_VERSION from performance_schema.replication_group_members;
+--------------------------------------+-------------+----------------+
| MEMBER_ID                            | MEMBER_ROLE | MEMBER_VERSION |
+--------------------------------------+-------------+----------------+
| 2adec6d2-febb-11ed-baca-d08e7908bcb1 | SECONDARY   | 8.0.32         |
| 2f68fee2-febb-11ed-b51e-d08e7908bcb1 | ARBITRATOR  | 8.0.32         |
| 5e34a5e2-feb6-11ed-b288-d08e7908bcb1 | PRIMARY     | 8.0.32         |
+--------------------------------------+-------------+----------------+

3. 观测SQL运行状态

查看当前连接/会话的连接ID、内部线程ID:

greatsql> select processlist_id, thread_id from performance_schema.threads where processlist_id = connection_id();
+----------------+-----------+
| processlist_id | thread_id |
+----------------+-----------+
|            110 |       207 |
+----------------+-----------+

查询得到当前的连接ID=110,内部线程ID=207。

P.S,由于本文整理过程不是连续的,所以下面看到的 thread_id 值可能会有好几个,每次都不同。

3.1 观测SQL运行时的内存消耗

执行下面的SQL,查询所有员工的薪资总额,按员工号分组,并按薪资总额倒序,取前10条记录:

greatsql> explain select emp_no, sum(salary) as total_salary from salaries group by emp_no order by total_salary desc limit 10\G
*************************** 1. row ***************************
           id: 1
  select_type: SIMPLE
        table: salaries
   partitions: NULL
         type: index
possible_keys: PRIMARY
          key: PRIMARY
      key_len: 7
          ref: NULL
         rows: 2838426
     filtered: 100.00
        Extra: Using temporary; Using filesort

看到需要全索引扫描(其实也等同于全表扫描,因为是基于PRIMARY索引),并且还需要生成临时表,以及额外的filesort。

在正式运行该SQL之前,在另外的窗口中新建一个连接会话,执行下面的SQL先观察该连接/会话当前的内存分配情况:

greatsql> select * from sys.x$memory_by_thread_by_current_bytes where thread_id = 207\G
*************************** 1. row ***************************
         thread_id: 207
              user: root@localhost
current_count_used: 9
 current_allocated: 26266
 current_avg_alloc: 2918.4444
 current_max_alloc: 16464
   total_allocated: 30311

等到该SQL执行完了,再一次查询内存分配情况:

greatsql> select * from sys.x$memory_by_thread_by_current_bytes where thread_id = 207\G
*************************** 1. row ***************************
         thread_id: 207
              user: root@localhost
current_count_used: 13
 current_allocated: 24430
 current_avg_alloc: 1879.2308
 current_max_alloc: 16456
   total_allocated: 95719

我们注意到几个数据的变化情况,用下面表格来展示:

指标 运行前 运行后
total_allocated 30311 95719

也就是说,SQL运行时,需要分配的内存是:95719 – 30311 = 65408 字节。

3.2 观测SQL运行时的其他开销

通过观察 performance_schema.status_by_thread 表,可以知道相应连接/会话中SQL运行的一些状态指标。在SQL运行结束后,执行下面的SQL命令即可查看:

greatsql> select * from performance_schema.status_by_thread where thread_id = 207;
...
|       207 | Created_tmp_disk_tables             | 0                        |
|       207 | Created_tmp_tables                  | 0                        |
...
|       207 | Handler_read_first                  | 1                        |
|       207 | Handler_read_key                    | 1                        |
|       207 | Handler_read_last                   | 0                        |
|       207 | Handler_read_next                   | 2844047                  |
|       207 | Handler_read_prev                   | 0                        |
|       207 | Handler_read_rnd                    | 0                        |
|       207 | Handler_read_rnd_next               | 0                        |
|       207 | Handler_rollback                    | 0                        |
|       207 | Handler_savepoint                   | 0                        |
|       207 | Handler_savepoint_rollback          | 0                        |
|       207 | Handler_update                      | 0                        |
|       207 | Handler_write                       | 0                        |
|       207 | Last_query_cost                     | 286802.914893            |
|       207 | Last_query_partial_plans            | 1                        |
...
|       207 | Select_full_join                    | 0                        |
|       207 | Select_full_range_join              | 0                        |
|       207 | Select_range                        | 0                        |
|       207 | Select_range_check                  | 0                        |
|       207 | Select_scan                         | 1                        |
|       207 | Slow_launch_threads                 | 0                        |
|       207 | Slow_queries                        | 1                        |
|       207 | Sort_merge_passes                   | 0                        |
|       207 | Sort_range                          | 0                        |
|       207 | Sort_rows                           | 1                       |
|       207 | Sort_scan                           | 1                        |
...

上面我们只罗列了部分比较重要的状态指标。从这个结果也可以佐证slow query log中的结果,确实没创建临时表。

作为参照,查看这条SQL对应的slow query log记录:

# Query_time: 0.585593  Lock_time: 0.000002 Rows_sent: 10  Rows_examined: 2844057 Thread_id: 110 Errno: 0 Killed: 0 Bytes_received: 115 Bytes_sent: 313 Read_first: 1 Read_last: 0 Read_key: 1 Read_next: 2844047 Read_prev: 0 Read_rnd: 0 Read_rnd_next: 0 Sort_merge_passes: 0 Sort_range_count: 0 Sort_rows: 10 Sort_scan_count: 1 Created_tmp_disk_tables: 0 Created_tmp_tables: 0 Start: 2023-07-06T10:06:01.438376+08:00 End: 2023-07-06T10:06:02.023969+08:00 Schema: employees Rows_affected: 0
# Tmp_tables: 0  Tmp_disk_tables: 0  Tmp_table_sizes: 0
# InnoDB_trx_id: 0
# Full_scan: Yes  Full_join: No  Tmp_table: No  Tmp_table_on_disk: No
# Filesort: Yes  Filesort_on_disk: No  Merge_passes: 0
#   InnoDB_IO_r_ops: 0  InnoDB_IO_r_bytes: 0  InnoDB_IO_r_wait: 0.000000
#   InnoDB_rec_lock_wait: 0.000000  InnoDB_queue_wait: 0.000000
#   InnoDB_pages_distinct: 4281
use employees;
SET timestamp=1688609161;
select emp_no, sum(salary) as total_salary from salaries group by emp_no order by total_salary desc limit 10;

可以看到,Created_tmp_disk_tables, Created_tmp_tables, Handler_read_next, Select_full_join, Select_scan, Sort_rows, Sort_scan, 等几个指标的数值是一样的。

还可以查看该SQL运行时的I/O latency情况,SQL运行前后两次查询对比:

greatsql> select * from sys.io_by_thread_by_latency where thread_id = 207;
+----------------+-------+---------------+-------------+-------------+-------------+-----------+----------------+
| user           | total | total_latency | min_latency | avg_latency | max_latency | thread_id | processlist_id |
+----------------+-------+---------------+-------------+-------------+-------------+-----------+----------------+
| root@localhost |     7 | 75.39 us      | 5.84 us     | 10.77 us    | 22.12 us    |       207 |            110 |
+----------------+-------+---------------+-------------+-------------+-------------+-----------+----------------+

...

greatsql> select * from sys.io_by_thread_by_latency where thread_id = 207;
+----------------+-------+---------------+-------------+-------------+-------------+-----------+----------------+
| user           | total | total_latency | min_latency | avg_latency | max_latency | thread_id | processlist_id |
+----------------+-------+---------------+-------------+-------------+-------------+-----------+----------------+
| root@localhost |     8 | 85.29 us      | 5.84 us     | 10.66 us    | 22.12 us    |       207 |            110 |
+----------------+-------+---------------+-------------+-------------+-------------+-----------+----------------+

可以看到这个SQL运行时的I/O latency是:85.29 – 75.39 = 9.9us。

3.3 观测SQL运行进度

我们知道,运行完一条SQL后,可以利用PROFLING功能查看它各个阶段的耗时,但是在运行时如果也想查看各阶段耗时该怎么办呢?

从MySQL 5.7版本开始,可以通过 performance_schema.events_stages_% 相关表查看SQL运行过程以及各阶段耗时,需要先修改相关设置:

# 确认是否对所有主机&用户都启用
greatsql> SELECT * FROM performance_schema.setup_actors;
+------+------+------+---------+---------+
| HOST | USER | ROLE | ENABLED | HISTORY |
+------+------+------+---------+---------+
| %    | %    | %    | NO      | NO      |
+------+------+------+---------+---------+

# 修改成对所有主机&用户都启用
greatsql> UPDATE performance_schema.setup_actors
 SET ENABLED = 'YES', HISTORY = 'YES'
 WHERE HOST = '%' AND USER = '%';

# 修改 setup_instruments & setup_consumers 设置
greatsql> UPDATE performance_schema.setup_consumers
 SET ENABLED = 'YES'
 WHERE NAME LIKE '%events_statements_%';

greatsql> UPDATE performance_schema.setup_consumers
 SET ENABLED = 'YES'
 WHERE NAME LIKE '%events_stages_%'; 

这就实时可以观测SQL运行过程中的状态了。

在SQL运行过程中,从另外的窗口查看该SQL对应的 EVENT_ID

greatsql> SELECT EVENT_ID, TRUNCATE(TIMER_WAIT/1000000000000,6) as Duration, SQL_TEXT        FROM performance_schema.events_statements_history WHERE thread_id = 85 order by event_id desc limit 5;
+----------+----------+-------------------------------------------------------------------------------------------------------------------------------+
| EVENT_ID | Duration | SQL_TEXT                                                                                                                      |
+----------+----------+-------------------------------------------------------------------------------------------------------------------------------+
|   149845 |   0.6420 | select emp_no, sum(salary) as total_salary, sleep(0.000001) from salaries group by emp_no order by total_salary desc limit 10 |
|   149803 |   0.6316 | select emp_no, sum(salary) as total_salary, sleep(0.000001) from salaries group by emp_no order by total_salary desc limit 10 |
|   149782 |   0.6245 | select emp_no, sum(salary) as total_salary, sleep(0.000001) from salaries group by emp_no order by total_salary desc limit 10 |
|   149761 |   0.6361 | select emp_no, sum(salary) as total_salary, sleep(0.000001) from salaries group by emp_no order by total_salary desc limit 10 |
|   149740 |   0.6245 | select emp_no, sum(salary) as total_salary, sleep(0.000001) from salaries group by emp_no order by total_salary desc limit 10 |
+----------+----------+-------------------------------------------------------------------------------------------------------------------------------+

# 再根据 EVENT_ID 值去查询 events_stages_history_long
greatsql> SELECT thread_id ,event_Id, event_name AS Stage, TRUNCATE(TIMER_WAIT/1000000000000,6) AS Duration  FROM performance_schema.events_stages_history_long WHERE NESTING_EVENT_ID = 149845 order by event_id;
+-----------+----------+------------------------------------------------+----------+
| thread_id | event_Id | Stage                                          | Duration |
+-----------+----------+------------------------------------------------+----------+
|        85 |   149846 | stage/sql/starting                             |   0.0000 |
|        85 |   149847 | stage/sql/Executing hook on transaction begin. |   0.0000 |
|        85 |   149848 | stage/sql/starting                             |   0.0000 |
|        85 |   149849 | stage/sql/checking permissions                 |   0.0000 |
|        85 |   149850 | stage/sql/Opening tables                       |   0.0000 |
|        85 |   149851 | stage/sql/init                                 |   0.0000 |
|        85 |   149852 | stage/sql/System lock                          |   0.0000 |
|        85 |   149854 | stage/sql/optimizing                           |   0.0000 |
|        85 |   149855 | stage/sql/statistics                           |   0.0000 |
|        85 |   149856 | stage/sql/preparing                            |   0.0000 |
|        85 |   149857 | stage/sql/Creating tmp table                   |   0.0000 |
|        85 |   149858 | stage/sql/executing                            |   0.6257 |
|        85 |   149859 | stage/sql/end                                  |   0.0000 |
|        85 |   149860 | stage/sql/query end                            |   0.0000 |
|        85 |   149861 | stage/sql/waiting for handler commit           |   0.0000 |
|        85 |   149862 | stage/sql/closing tables                       |   0.0000 |
|        85 |   149863 | stage/sql/freeing items                        |   0.0000 |
|        85 |   149864 | stage/sql/logging slow query                   |   0.0000 |
|        85 |   149865 | stage/sql/cleaning up                          |   0.0000 |
+-----------+----------+------------------------------------------------+----------+

上面就是这条SQL的运行进度展示,以及各个阶段的耗时,和PROFILING的输出一样,当我们了解一条SQL运行所需要经历的各个阶段时,从上面的输出结果中也就能估算出该SQL大概还要多久能跑完,决定是否要提前kill它。

如果想要观察DDL SQL的运行进度,可以参考这篇文章:不用MariaDB/Percona也能查看DDL的进度

更多的观测指标、维度还有待继续挖掘​,以后有机会再写。​

延伸阅读
Query Profiling Using Performance Schema, https://dev.mysql.com/doc/refman/8.0/en/performance-schema-query-profiling.html
不用MariaDB/Percona也能查看DDL的进度
事件记录 | performance_schema全方位介绍
内存分配统计视图 | 全方位认识 sys 系统库

全文完 :)

自打有了GIPKs,DBA和开发再也不用battle了

>

GIPKs解决了历史难题

1. GIPKs特性简介

从MySQL 8.0.30开始,新引入一个叫做GPIKs的特性,其全称是 Generated Invisible Primary Keys,简言之就是 自动生成隐含的主键列,更完整的说法是:启用GIPKs后,当新建的InnoDB表没有显式主键时,会自动创建一个不可见的主键列 my_row_id,这个列会被定义为 bigint unsigned NOT NULL AUTO_INCREMENT,并且是不可见的(INVISIBLE)。

2. GIPKs特性的作用

实际上这个特性在有些分支版本上早就已经实现了,这个需求也是非常迫切,MySQL官方对这个特性的支持虽迟但到,积极意义还是很大滴,解决了几个历史难题:
1. DBA无需再和开发battle,强调一定要有显式自增主键列。当然了,个别情况下非要显式指定非自增列(例如选择UUID/VARCHAR类型列)做主键的,DBA也无可奈何啊。
2. 在MGR架构中,也不用要求每个InnoDB表都必须要有显式定义的主键列。

上述这两种情况下,都可以从GIPKs特性中获益,会自动创建隐含的 my_row_id 主键列。

GIPKs特性带来的一点点不便是,当我们想要显式创建一个名为 my_row_id 的列名时,会报错,不让创建,因为被GIPKs特性给当做保留关键字了,例如:

greatsql> create table t2(
id bigint unsigned not null auto_increment,
my_row_id int NOT NULL);
ERROR 4109 (HY000): Failed to generate invisible primary key. Auto-increment column already exists.

需要注意的是,在传统主从复制或MGR架构中,GIPKs特性的设置值不会被复制到从节点,仅影响当前节点。不过,这完全不影响主从复制或MGR的正常工作,也就是说:在主节点上创建无显式定义主键列的表数据,可以正常复制到从节点。前提条件是设置 binlog_format = row,在MGR中,要求binlog必须采用row格式。

另外,mysqldump 中也相应增加了新选项 --skip-generated-invisible-primary-key,用于指定备份时是否要忽略隐含主键列。

3. 玩转GIPKs

下面我们在MGR环境中举栗说明怎么玩转GIPKs特性:

# 当前使用 GreatSQL 8.0.32-24 版本
greatsql> \s
..
Server version:     8.0.32-24 GreatSQL, Release 24, Revision 3714067bc8c
...

# 在MGR环境中测试
greatsql> select * from performance_schema.replication_group_members;
+---------------------------+--------------------------------------+---------------+-------------+--------------+-------------+----------------+----------------------------+
| CHANNEL_NAME              | MEMBER_ID                            | MEMBER_HOST   | MEMBER_PORT | MEMBER_STATE | MEMBER_ROLE | MEMBER_VERSION | MEMBER_COMMUNICATION_STACK |
+---------------------------+--------------------------------------+---------------+-------------+--------------+-------------+----------------+----------------------------+
| group_replication_applier | 2adec6d2-febb-11ed-baca-d08e7908bcb1 | 192.168.5.160 |        3307 | ONLINE       | SECONDARY   | 8.0.32         | XCom                       |
| group_replication_applier | 2f68fee2-febb-11ed-b51e-d08e7908bcb1 | 192.168.5.160 |        3308 | ONLINE       | ARBITRATOR  | 8.0.32         | XCom                       |
| group_replication_applier | 5e34a5e2-feb6-11ed-b288-d08e7908bcb1 | 192.168.5.160 |        3306 | ONLINE       | PRIMARY     | 8.0.32         | XCom                       |
+---------------------------+--------------------------------------+---------------+-------------+--------------+-------------+----------------+----------------------------+

# 确认启用GIPKs特性
greatsql> show variables like 'sql_generate_invisible_primary_key';
+------------------------------------+-------+
| Variable_name                      | Value |
+------------------------------------+-------+
| sql_generate_invisible_primary_key | ON    |
+------------------------------------+-------+

# 新建表,未显式指定主键列
greatsql> create table t1 ( id int not null, c1 varchar(10) not null, unique key(id));

greatsql> show create table t1\G
*************************** 1. row ***************************
       Table: t1
Create Table: CREATE TABLE `t1` (
  `my_row_id` bigint unsigned NOT NULL AUTO_INCREMENT /*!80023 INVISIBLE */,
  `id` int NOT NULL,
  `c1` varchar(10) NOT NULL,
  PRIMARY KEY (`my_row_id`),
  UNIQUE KEY `id` (`id`)
) ENGINE=InnoDB DEFAULT CHARSET=utf8mb4 COLLATE=utf8mb4_0900_ai_ci

可以看到,在建表时已经创建了唯一索引列(该索引列可以被选用作聚集索引),但由于没显式指定主键索引,所以还是会创建一个隐含的主键列 my_row_id,这个隐含的主键列默认是不可见的,除非我们手动修改其可见性。

# 即便是 SELECT *,也无法读取隐含的主键列
greatsql> select * from t1;
+----+----+
| id | c1 |
+----+----+
|  1 | c1 |
|  2 | c2 |
+----+----+

# 除非修改隐含主键列为可见
greatsql> alter table t1 alter column my_row_id set visible;

# 这时就能看到这个隐含主键列
greatsql> select * from t1;
+-----------+----+----+
| my_row_id | id | c1 |
+-----------+----+----+
|         1 |  1 | c1 |
|         2 |  2 | c2 |
+-----------+----+----+

# 再次查看表结构
greatsql> show create table t1\G
*************************** 1. row ***************************
       Table: t1
Create Table: CREATE TABLE `t1` (
  `my_row_id` bigint unsigned NOT NULL AUTO_INCREMENT,
  `id` int NOT NULL,
  `c1` varchar(10) NOT NULL,
  PRIMARY KEY (`my_row_id`),
  UNIQUE KEY `id` (`id`)
) ENGINE=InnoDB AUTO_INCREMENT=3 DEFAULT CHARSET=utf8mb4 COLLATE=utf8mb4_0900_ai_ci

# 还可以再次将其设置为不可见
greatsql> alter table t1 alter column my_row_id set invisible;

greatsql> show create table t1\G
*************************** 1. row ***************************
       Table: t1
Create Table: CREATE TABLE `t1` (
  `my_row_id` bigint unsigned NOT NULL AUTO_INCREMENT /*!80023 INVISIBLE */,
  `id` int NOT NULL,
  `c1` varchar(10) NOT NULL,
  PRIMARY KEY (`my_row_id`),
  UNIQUE KEY `id` (`id`)
) ENGINE=InnoDB AUTO_INCREMENT=3 DEFAULT CHARSET=utf8mb4 COLLATE=utf8mb4_0900_ai_ci

如果不想继续使用该隐含列作为主键,可以执行类似下面的SQL命令进行修改:

# 删除隐含主键列、主键,并新建自定义的主键列
greatsql> alter table t1 drop column my_row_id, drop primary key, add aid bigint unsigned not null auto_increment primary key first;

# 再次查看表结构和查询表数据
greatsql> show create table t1\G
*************************** 1. row ***************************
       Table: t1
Create Table: CREATE TABLE `t1` (
  `aid` bigint unsigned NOT NULL AUTO_INCREMENT,
  `id` int NOT NULL,
  `c1` varchar(10) NOT NULL,
  PRIMARY KEY (`aid`),
  UNIQUE KEY `id` (`id`)
) ENGINE=InnoDB AUTO_INCREMENT=3 DEFAULT CHARSET=utf8mb4 COLLATE=utf8mb4_0900_ai_ci

greatsql> select * from t1;
+-----+----+----+
| aid | id | c1 |
+-----+----+----+
|   1 |  1 | c1 |
|   2 |  2 | c2 |
+-----+----+----+

可以看到,GIPKs特性还是很灵活实用的。

P.S,最新发布的GreatSQL 8.0.32-24版本中,已经包含了该特性,可以放心使用。

全文完。

Enjoy MySQL :)

延伸阅读
– Generated Invisible Primary Keys, https://dev.mysql.com/doc/refman/8.0/en/create-table-gipks.html
– Changes in GreatSQL 8.0.32-24, https://gitee.com/GreatSQL/GreatSQL-Doc/blob/master/relnotes/greatsql-803224/changes-greatsql-8-0-32-24-20230605.md

从零开始学习MySQL调试跟踪(2)

上一篇文档介绍了如何构建gdb跟踪调试环境,本文介绍如何根据错误日志信息,跟踪定位问题可能的原因,以及如何利用coredump文件查找问题线索。

1. 启用coredump

程序运行过程中可能会异常终止或崩溃,OS会把程序挂掉时的内存状态记录下来,写入core文件,这就叫 coredump,通过gdb结合core文件可以方便地进行调试。

利用core文件中保留的异常堆栈文件,能够帮助研发同学更快定位问题。因此,如果某些故障断断续续会出现,建议阶段性开启coredump功能。

想要开启coredump,需要先修改OS层的几个设置:

$ ulimit -c unlimited
$ sysctl -w fs.suid_dumpable=2
$ echo "core.%p.%e.%s" > /proc/sys/kernel/core_pattern

同时,将这些修改持久化到相应文件中(假定MySQL/GreatSQL服务进程的属主用户是 mysql):

$ echo "mysql  -  core   unlimited" >> /etc/security/limits.conf
$ echo "fs.suid_dumpable=2" >> /etc/sysctl.conf
$ echo "kernel.core_pattern=core.%e.%p.%t" >> /etc/sysctl.conf
$ sysctl -p

接下来,修改 my.cnf 配置文件,增加以下两行内容:

core_file
innodb_buffer_pool_in_core_file=OFF

然后重启GreatSQL服务进程,即可生效,查询确认下:

mysql> show global variables like '%core%';
+---------------------------------+-------+
| Variable_name                   | Value |
+---------------------------------+-------+
| core_file                       | ON    |
| innodb_buffer_pool_in_core_file | OFF   |
+---------------------------------+-------+

这样设置完成后,需要的话会在 datadir 目录下生成core文件。

2. 制造一个coredump场景

我们可以给mysqld进程发送 SIGSEGV(11) 信号,即可模拟出coredump的场景,例如:

$ kill -s SIGSEGV `pidof mysqld`

这时查看GreatSQL错误日志文件,以及core文件,就会发现有coredump:

$ls -la 
...
-rw-------   1 mysql mysql 1081147392 Feb 20 22:36 core.mysqld-debug.2658134.1676903816
...

$ less error.log
...
14:36:56 UTC - mysqld got signal 11 ;
Most likely, you have hit a bug, but this error can also be caused by malfunctioning hardware.

Build ID: 1f4232b893100742b7c519df2fa714648c2d76d9
Server Version: 8.0.25-16-debug Source distribution

Thread pointer: 0x0
Attempting backtrace. You can use the following information to find out
where mysqld died. If you see no messages after this, something went
terribly wrong...
stack_bottom = 0 thread_stack 0x80000
/usr/local/GreatSQL-8.0.25-16-Linux-glibc2.28-x86_64/bin/mysqld-debug(my_print_stacktrace(unsigned char const*, unsigned long)+0x43) [0x4b04
d26]
/usr/local/GreatSQL-8.0.25-16-Linux-glibc2.28-x86_64/bin/mysqld-debug(handle_fatal_signal+0x2cb) [0x39a7d22]
/lib64/libpthread.so.0(+0x12c20) [0x7fc3e669ac20]
/lib64/libc.so.6(__poll+0x51) [0x7fc3e45c4a41]
/usr/local/GreatSQL-8.0.25-16-Linux-glibc2.28-x86_64/bin/mysqld-debug(Mysqld_socket_listener::listen_for_connection_event()+0x57) [0x3995195
]
/usr/local/GreatSQL-8.0.25-16-Linux-glibc2.28-x86_64/bin/mysqld-debug(Connection_acceptor<Mysqld_socket_listener>::connection_event_loop()+0
x30) [0x355a024]
/usr/local/GreatSQL-8.0.25-16-Linux-glibc2.28-x86_64/bin/mysqld-debug(mysqld_main(int, char**)+0x27d2) [0x354e4a6]
/usr/local/GreatSQL-8.0.25-16-Linux-glibc2.28-x86_64/bin/mysqld-debug(main+0x20) [0x32de906]
/lib64/libc.so.6(__libc_start_main+0xf3) [0x7fc3e44f6493]
/usr/local/GreatSQL-8.0.25-16-Linux-glibc2.28-x86_64/bin/mysqld-debug(_start+0x2e) [0x32de82e]
Please help us make Percona Server better by reporting any
bugs at https://bugs.percona.com/
...

在一线的同学,如果需要向研发寻求支持或报告故障时,可以先参考这篇文章 MySQL报障之coredump收集处理流程,需要采集其他几个信息:
– 故障时刻的error log。
– 故障产生的core文件。
– 如果有general log的话,也采集起来(故障时刻往前约1小时或10万行日志)。
– 导致core发生涉及到的表DDL以及相应的SQL语句,有必要的话,可能还要同时提供真实数据(或样例数据)。

3. 真实故障场景分析跟踪

在GreatSQL 8.0.25-15版本(上一个版本)中,InnoDB并行查询功能在特定场景下存在bug,会导致crash,相应的日志见下:

mysqld-debug: /opt/greatsql-8.0.25/sql/item.cc:6047: virtual void Item_field::make_field(Send_field*): Assertion `item_name.is_set()' failed.
01:59:20 UTC - mysqld got signal 6 ;
Most likely, you have hit a bug, but this error can also be caused by malfunctioning hardware.

Build ID: 1f4232b893100742b7c519df2fa714648c2d76d9
Server Version: 8.0.25-debug Source distribution

Thread pointer: 0x7fb4a9a0b000
Attempting backtrace. You can use the following information to find out
where mysqld died. If you see no messages after this, something went
terribly wrong...
stack_bottom = 7fb4f7aa53b0 thread_stack 0x80000
/usr/local/GreatSQL-8.0.25-Linux-glibc2.28-x86_64/bin/mysqld-debug(my_print_stacktrace(unsigned char const*, unsigned long)+0x43) [0x4b04d26]
/usr/local/GreatSQL-8.0.25-Linux-glibc2.28-x86_64/bin/mysqld-debug(handle_fatal_signal+0x2cb) [0x39a7d22]
/lib64/libpthread.so.0(+0x12c20) [0x7fb5146cac20]
/lib64/libc.so.6(gsignal+0x10f) [0x7fb51253a37f]
/lib64/libc.so.6(abort+0x127) [0x7fb512524db5]
/lib64/libc.so.6(+0x21c89) [0x7fb512524c89]
/lib64/libc.so.6(+0x2fa76) [0x7fb512532a76]  #<--从这里网上,都是错误信息处理逻辑
/usr/local/GreatSQL-8.0.25-Linux-glibc2.28-x86_64/bin/mysqld-debug(Item_field::make_field(Send_field*)+0x9e) [0x3338758]  #<--从这里往下,才是真正触发故障的位置,并记住 "0x3338758" 这个指针
/usr/local/GreatSQL-8.0.25-Linux-glibc2.28-x86_64/bin/mysqld-debug(THD::send_result_metadata(mem_root_deque<Item*> const&, unsigned int)+0x19d) [0x36977ab]
/usr/local/GreatSQL-8.0.25-Linux-glibc2.28-x86_64/bin/mysqld-debug(Query_result_send::send_result_set_metadata(THD*, mem_root_deque<Item*> const&, unsigned int)+0x2d) [0x35f3ff9]
/usr/local/GreatSQL-8.0.25-Linux-glibc2.28-x86_64/bin/mysqld-debug(Query_expression::ExecuteIteratorQuery(THD*)+0x1f1) [0x38d057b]
/usr/local/GreatSQL-8.0.25-Linux-glibc2.28-x86_64/bin/mysqld-debug(Query_expression::execute(THD*)+0xed) [0x38d0d7d]
/usr/local/GreatSQL-8.0.25-Linux-glibc2.28-x86_64/bin/mysqld-debug(Sql_cmd_dml::execute_inner(THD*)+0x1c1) [0x381db25]
/usr/local/GreatSQL-8.0.25-Linux-glibc2.28-x86_64/bin/mysqld-debug(Sql_cmd_dml::execute(THD*)+0x5c7) [0x381cfab]
/usr/local/GreatSQL-8.0.25-Linux-glibc2.28-x86_64/bin/mysqld-debug(mysql_execute_command(THD*, bool)+0x565c) [0x37a1a2b]
/usr/local/GreatSQL-8.0.25-Linux-glibc2.28-x86_64/bin/mysqld-debug(dispatch_sql_command(THD*, Parser_state*, bool)+0x769) [0x37a3a1d]
/usr/local/GreatSQL-8.0.25-Linux-glibc2.28-x86_64/bin/mysqld-debug(dispatch_command(THD*, COM_DATA const*, enum_server_command)+0x1491) [0x3799819]
/usr/local/GreatSQL-8.0.25-Linux-glibc2.28-x86_64/bin/mysqld-debug(do_command(THD*)+0x51c) [0x3797c48]
/usr/local/GreatSQL-8.0.25-Linux-glibc2.28-x86_64/bin/mysqld-debug() [0x3991168]
/usr/local/GreatSQL-8.0.25-Linux-glibc2.28-x86_64/bin/mysqld-debug() [0x52e4b22]
/lib64/libpthread.so.0(+0x817a) [0x7fb5146c017a]
/lib64/libc.so.6(clone+0x43) [0x7fb5125ffdc3]

Trying to get some variables.
Some pointers may be invalid and cause the dump to abort.
Query (7fb4a9a65028): SELECT  ...  FROM t1 WHERE ...  #<-- 这是触发bug的SQL语句
Connection ID (thread ID): 8
Status: NOT_KILLED

按照上面所说的方法,我们采集了所有相关信息,并能在测试环境重现上述故障。

接下来,我们利用gdb来定位分析问题原因:

$ gdb path/bin/mysqld-debug path/core.mysqld-debug.2657287.1657270311
GNU gdb (GDB) Red Hat Enterprise Linux 9.2-4.el8
...
Type "apropos word" to search for commands related to "word"...
Reading symbols from ./bin/mysqld-debug...
...
[New LWP 2675795]
[New LWP 2675825]
[Thread debugging using libthread_db enabled]
Using host libthread_db library "/lib64/libthread_db.so.1".
--Type <RET> for more, q to quit, c to continue without paging--
Core was generated by `./bin/mysqld-debug --defaults-extra-file=./my.cnf'.
Program terminated with signal SIGABRT, Aborted.
#0  __pthread_kill (threadid=<optimized out>, signo=6) at ../sysdeps/unix/sysv/linux/pthread_kill.c:56
56        return (INTERNAL_SYSCALL_ERROR_P (val, err)
[Current thread is 1 (Thread 0x7fb4f7aa7700 (LWP 2676055))]
(gdb)
(gdb) b *0x3338758  #<-- 上面记下的指针值,前面加个 "*" 号,在这里打上断点
Breakpoint 1 at 0x3338758: file /opt/greatsql-8.0.25/sql/item.cc, line 6048.  #<-- 指向可能触发问题的源码位置
(gdb)
(gdb) bt  #<-- 打印详细backtrace信息
#0  __pthread_kill (threadid=<optimized out>, signo=6) at ../sysdeps/unix/sysv/linux/pthread_kill.c:56
#1  0x0000000004b04f1d in my_write_core (sig=6) at /opt/greatsql-8.0.25/mysys/stacktrace.cc:409
#2  0x00000000039a7f84 in handle_fatal_signal (sig=6) at /opt/greatsql-8.0.25/sql/signal_handler.cc:199
#3  <signal handler called>
#4  __GI_raise (sig=sig@entry=6) at ../sysdeps/unix/sysv/linux/raise.c:50
#5  0x00007fb512524db5 in __GI_abort () at abort.c:79
#6  0x00007fb512524c89 in __assert_fail_base (fmt=0x7fb51268d698 "%s%s%s:%u: %s%sAssertion `%s' failed.\n%n", assertion=0x57a1835 "item_name.is_set()",
    file=0x57a1400 "/opt/greatsql-8.0.25/sql/item.cc", line=6047, function=<optimized out>) at assert.c:92
#7  0x00007fb512532a76 in __GI___assert_fail (assertion=0x57a1835 "item_name.is_set()", file=0x57a1400 "/opt/greatsql-8.0.25/sql/item.cc", line=6047,
    function=0x57a3a40 "virtual void Item_field::make_field(Send_field*)") at assert.c:101
#8  0x0000000003338758 in Item_field::make_field (this=0x7fb4a9b5bcf8, tmp_field=0x7fb4f7aa2380) at /opt/greatsql-8.0.25/sql/item.cc:6047
#9  0x00000000036977ab in THD::send_result_metadata (this=0x7fb4a9a0b000, list=..., flags=5) at /opt/greatsql-8.0.25/sql/sql_class.cc:2824
#10 0x00000000035f3ff9 in Query_result_send::send_result_set_metadata (this=0x7fb4a9a0fda0, thd=0x7fb4a9a0b000, list=..., flags=5)
    at /opt/greatsql-8.0.25/sql/query_result.cc:76
#11 0x00000000038d057b in Query_expression::ExecuteIteratorQuery (this=0x7fb4a9a65178, thd=0x7fb4a9a0b000) at /opt/greatsql-8.0.25/sql/sql_union.cc:1150
#12 0x00000000038d0d7d in Query_expression::execute (this=0x7fb4a9a65178, thd=0x7fb4a9a0b000) at /opt/greatsql-8.0.25/sql/sql_union.cc:1321
#13 0x000000000381db25 in Sql_cmd_dml::execute_inner (this=0x7fb4a9a0fd68, thd=0x7fb4a9a0b000) at /opt/greatsql-8.0.25/sql/sql_select.cc:814
#14 0x000000000381cfab in Sql_cmd_dml::execute (this=0x7fb4a9a0fd68, thd=0x7fb4a9a0b000) at /opt/greatsql-8.0.25/sql/sql_select.cc:585
#15 0x00000000037a1a2b in mysql_execute_command (thd=0x7fb4a9a0b000, first_level=true) at /opt/greatsql-8.0.25/sql/sql_parse.cc:4684
#16 0x00000000037a3a1d in dispatch_sql_command (thd=0x7fb4a9a0b000, parser_state=0x7fb4f7aa41d0, update_userstat=false)
    at /opt/greatsql-8.0.25/sql/sql_parse.cc:5284
#17 0x0000000003799819 in dispatch_command (thd=0x7fb4a9a0b000, com_data=0x7fb4f7aa5370, command=COM_QUERY) at /opt/greatsql-8.0.25/sql/sql_parse.cc:1940
#18 0x0000000003797c48 in do_command (thd=0x7fb4a9a0b000) at /opt/greatsql-8.0.25/sql/sql_parse.cc:1388
#19 0x0000000003991168 in handle_connection (arg=0x7fb4ba094500) at /opt/greatsql-8.0.25/sql/conn_handler/connection_handler_per_thread.cc:307
#20 0x00000000052e4b22 in pfs_spawn_thread (arg=0x7fb511e44320) at /opt/greatsql-8.0.25/storage/perfschema/pfs.cc:2899
#21 0x00007fb5146c017a in start_thread (arg=<optimized out>) at pthread_create.c:479
#22 0x00007fb5125ffdc3 in clone () at ../sysdeps/unix/sysv/linux/x86_64/clone.S:95

有了这些信息,研发同学再去跟踪定位问题根源就会方便很多。

本文简单演示了如何利用core文件去跟踪定位分析可能导致crash的原因,更多有趣实用的方法还有待进一步挖掘,一起探索新世界吧。

延伸阅读
– https://gohalo.me/post/mysql-core-file.html
– https://zhuanlan.zhihu.com/p/275698560
– https://blog.csdn.net/weixin_35186171/article/details/113425698
– https://blog.csdn.net/weixin_34565946/article/details/113299910